Graphing Proportional Relationships


Explore how ratios come to life on a coordinate grid with Graphing Proportional Relationships! This playsheet helps you see how two quantities that grow at a constant rate create straight lines that always pass through the origin. By connecting data to visuals, you’ll strengthen your understanding of proportional reasoning and real-world math.
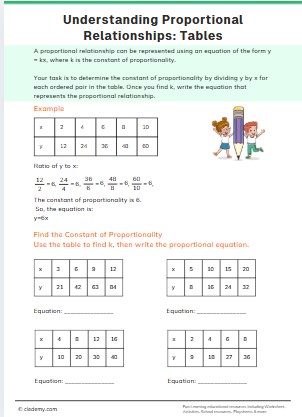
You’ll begin by analyzing tables that show pairs of related values. As you compare numbers, you’ll notice a steady pattern — each pair increases by the same factor or shares the same unit rate. These clues help you confirm that the relationship is proportional and ready to be graphed.
Next, you’ll plot the points from each table onto a coordinate plane. As you connect them, you’ll see a straight line form, showing how the ratio grows predictably over time. This process helps you understand how the constant of proportionality becomes the slope of your line, shaping its direction and steepness.


 G8
G8 Math
Math Math Concepts
 Proportion
 Graphs
 Educational Skills
 Thinking Skills
 Mathematical Skill
 Problem-Solving